
Are you struggling to measure the alignment, focus, and simplicity created by your Revenue Operations strategy? You’re not alone. Many businesses are stuck in vanity metrics that don’t offer reliable insights into their performance. That’s why we’ve compiled a list of the top five key performance indicators (KPIs) to track for effective revenue operations.
A single KPI will not suffice if you are striving to properly measure your team’s success. A more holistic approach must be taken – one that incorporates metrics such as cost of customer acquisitions, speed of sales pipelines and more.
5 top revenue operations metrics to track:
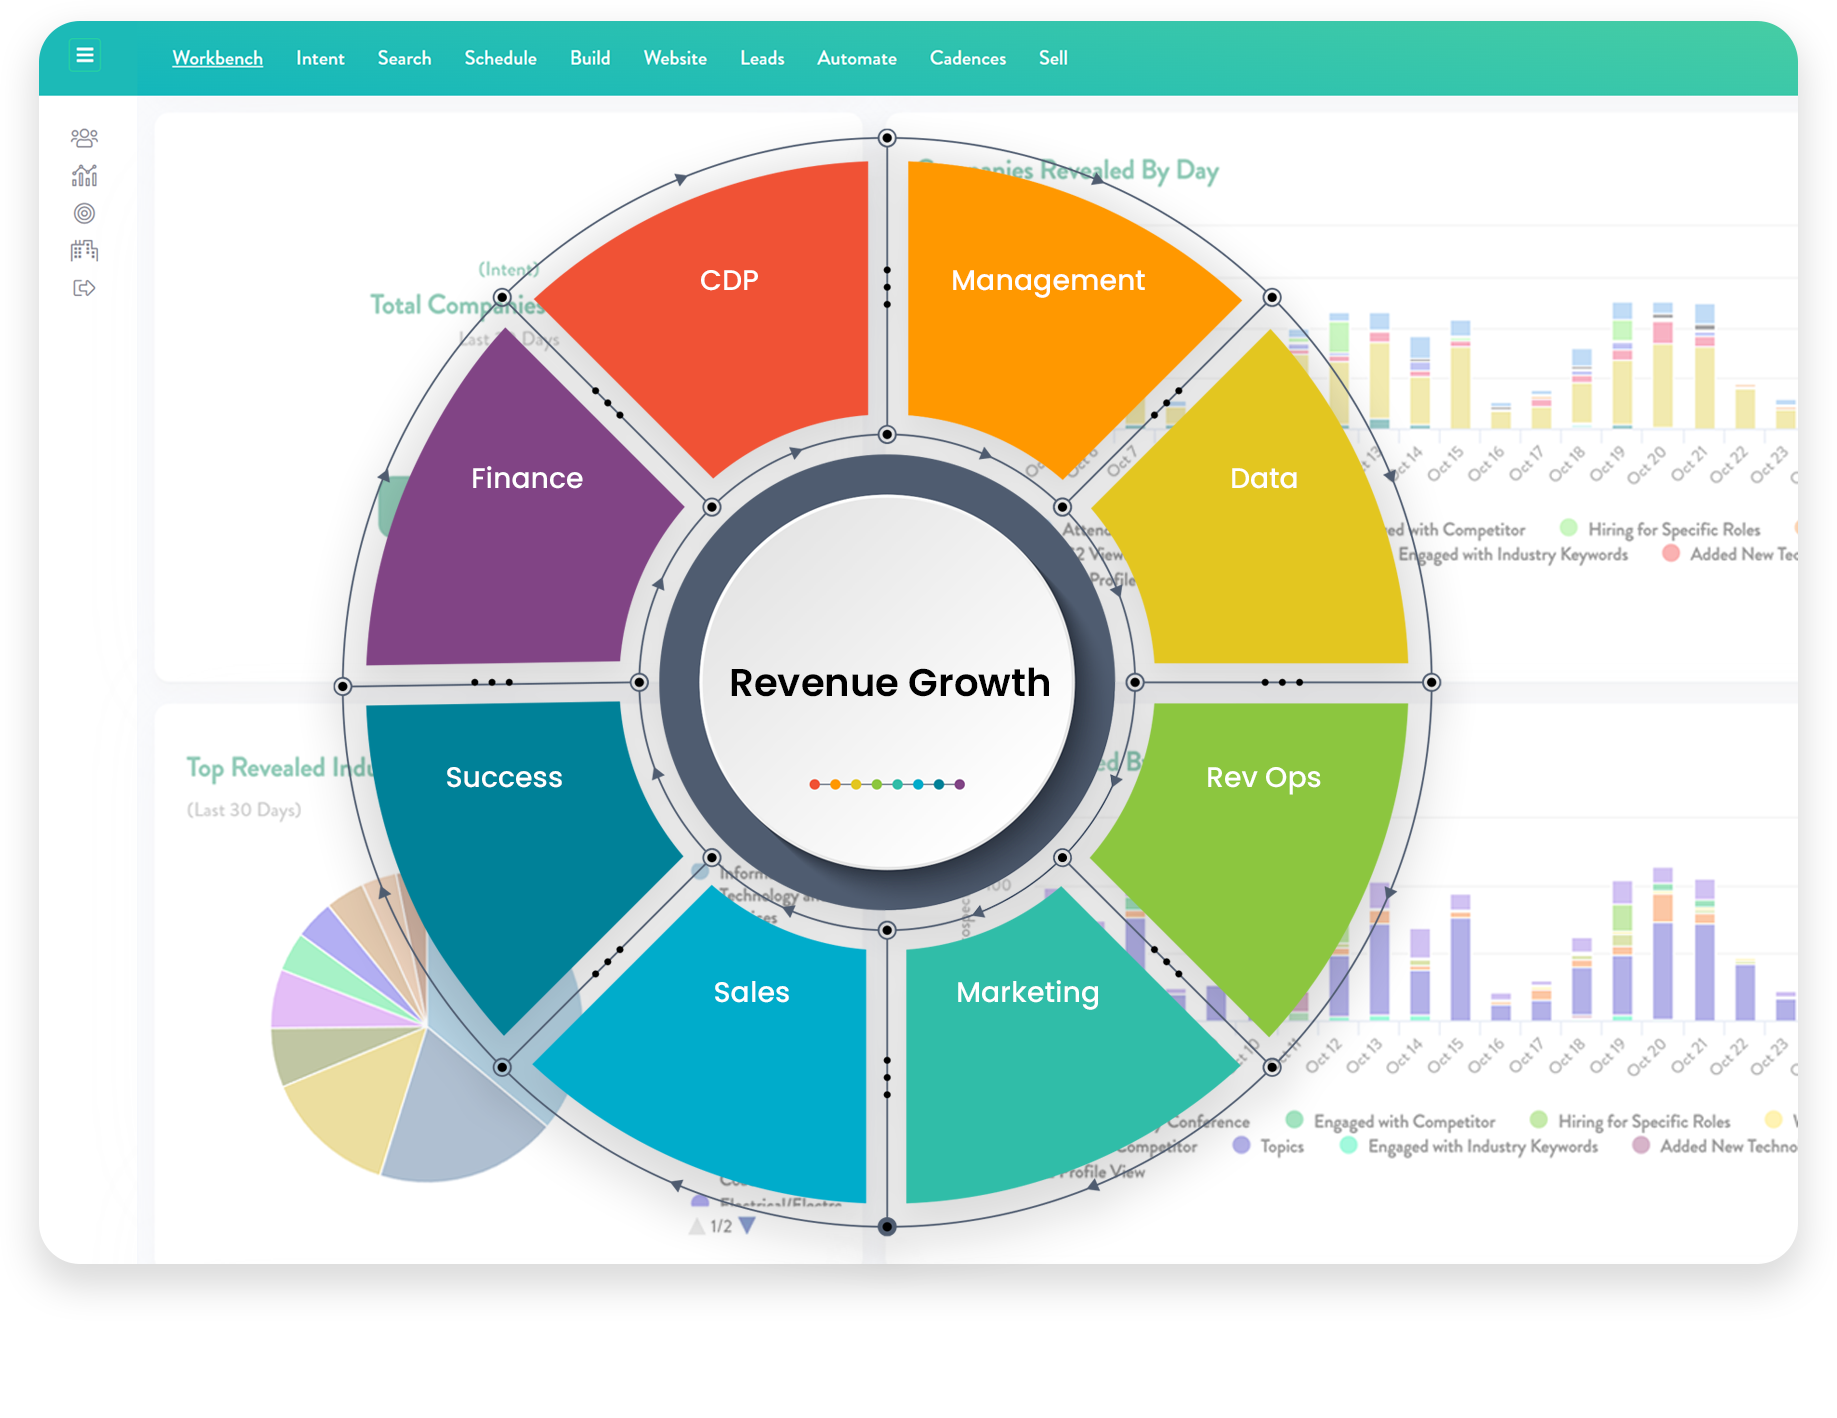
Revenue Growth:
It is essential to track the money your business is generating and therefore, your RevOps function should be monitoring this. Your Annual Recurring Revenue (ARR) – or the total contracted revenue your company takes in each year – is of particular importance, as it is especially useful for SaaS businesses utilising subscription models. betterment of your business.
The ARR calculation:
Annual recurring revenue (ARR) = (total value of a contract) / (number of contract years)
By tracking revenue growth over time, businesses can identify trends and patterns and make informed decisions to optimise revenue growth.
Customer Acquisition Cost (CAC):
How much does it cost you to acquire a new customer? This is an integral metric to track; by identifying and optimising your cost-effective customer acquisition channels, you can ensure you are gaining more value than you are investing. In fact, a 1% improvement to your CAC can lead to a 3.32% growth in revenue – all while keeping customer churn low.
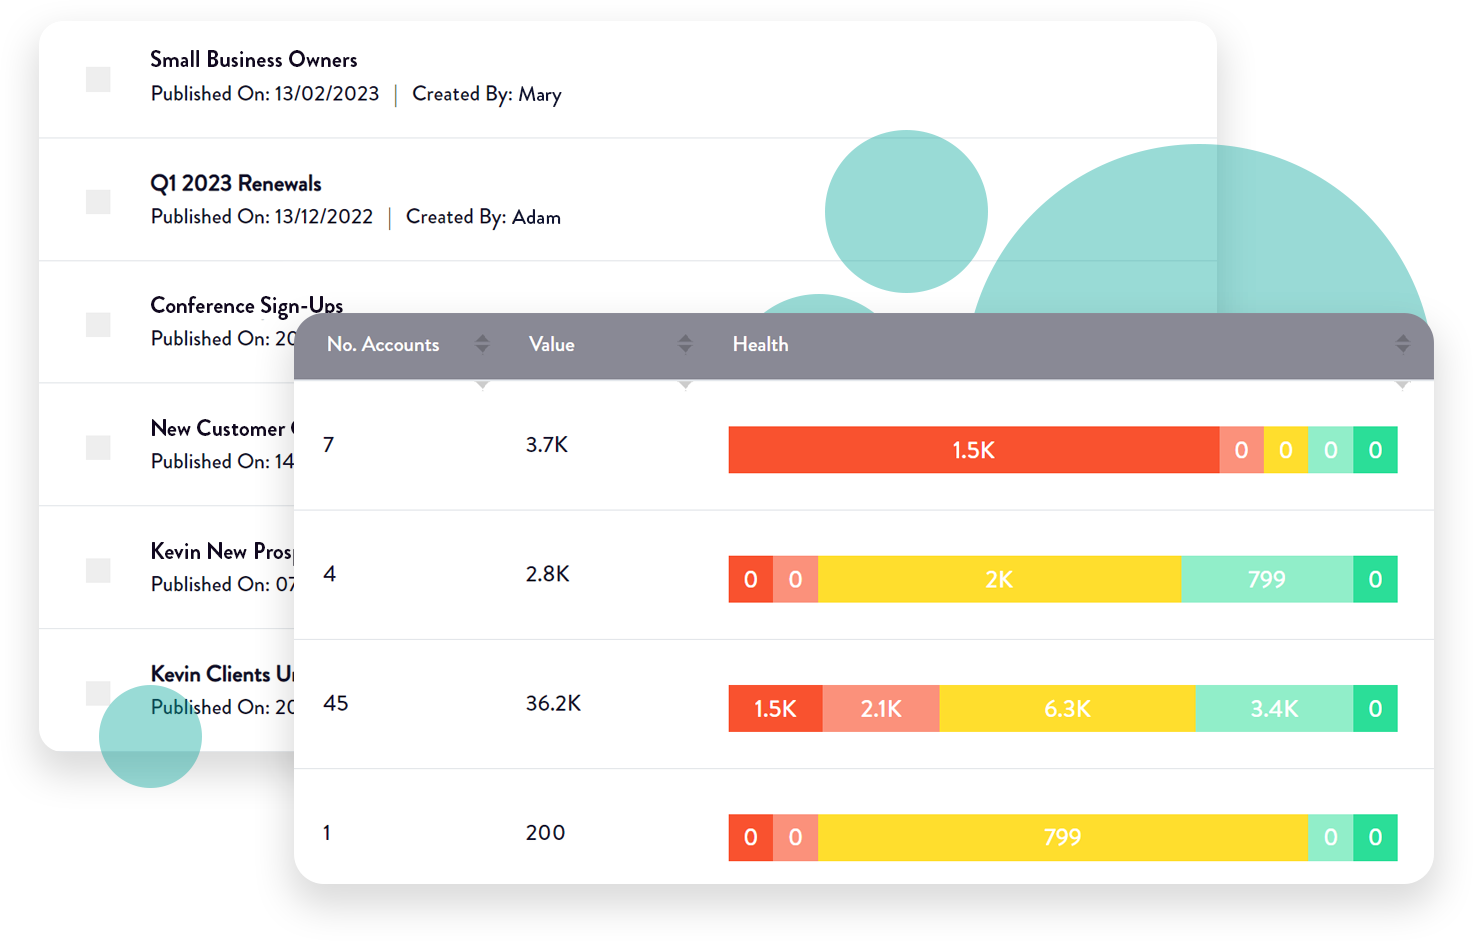
Customer Churn Rate:
This refers to the amount of customers who choose not to renew their subscription in any given time period. It is crucial to monitor this if you are operating with a subscription model, as gaining customers at the same rate as you are losing them means your net growth remains stagnant.
The churn rate calculation:
Churn rate = number of churned customers / total number of customers
Identifying accounts at risk of churning can be tricky and often require complex spreadsheets, but new technologies can provide customer success teams with more visibility into renewals at risk so they can take a proactive approach to preventing churn.
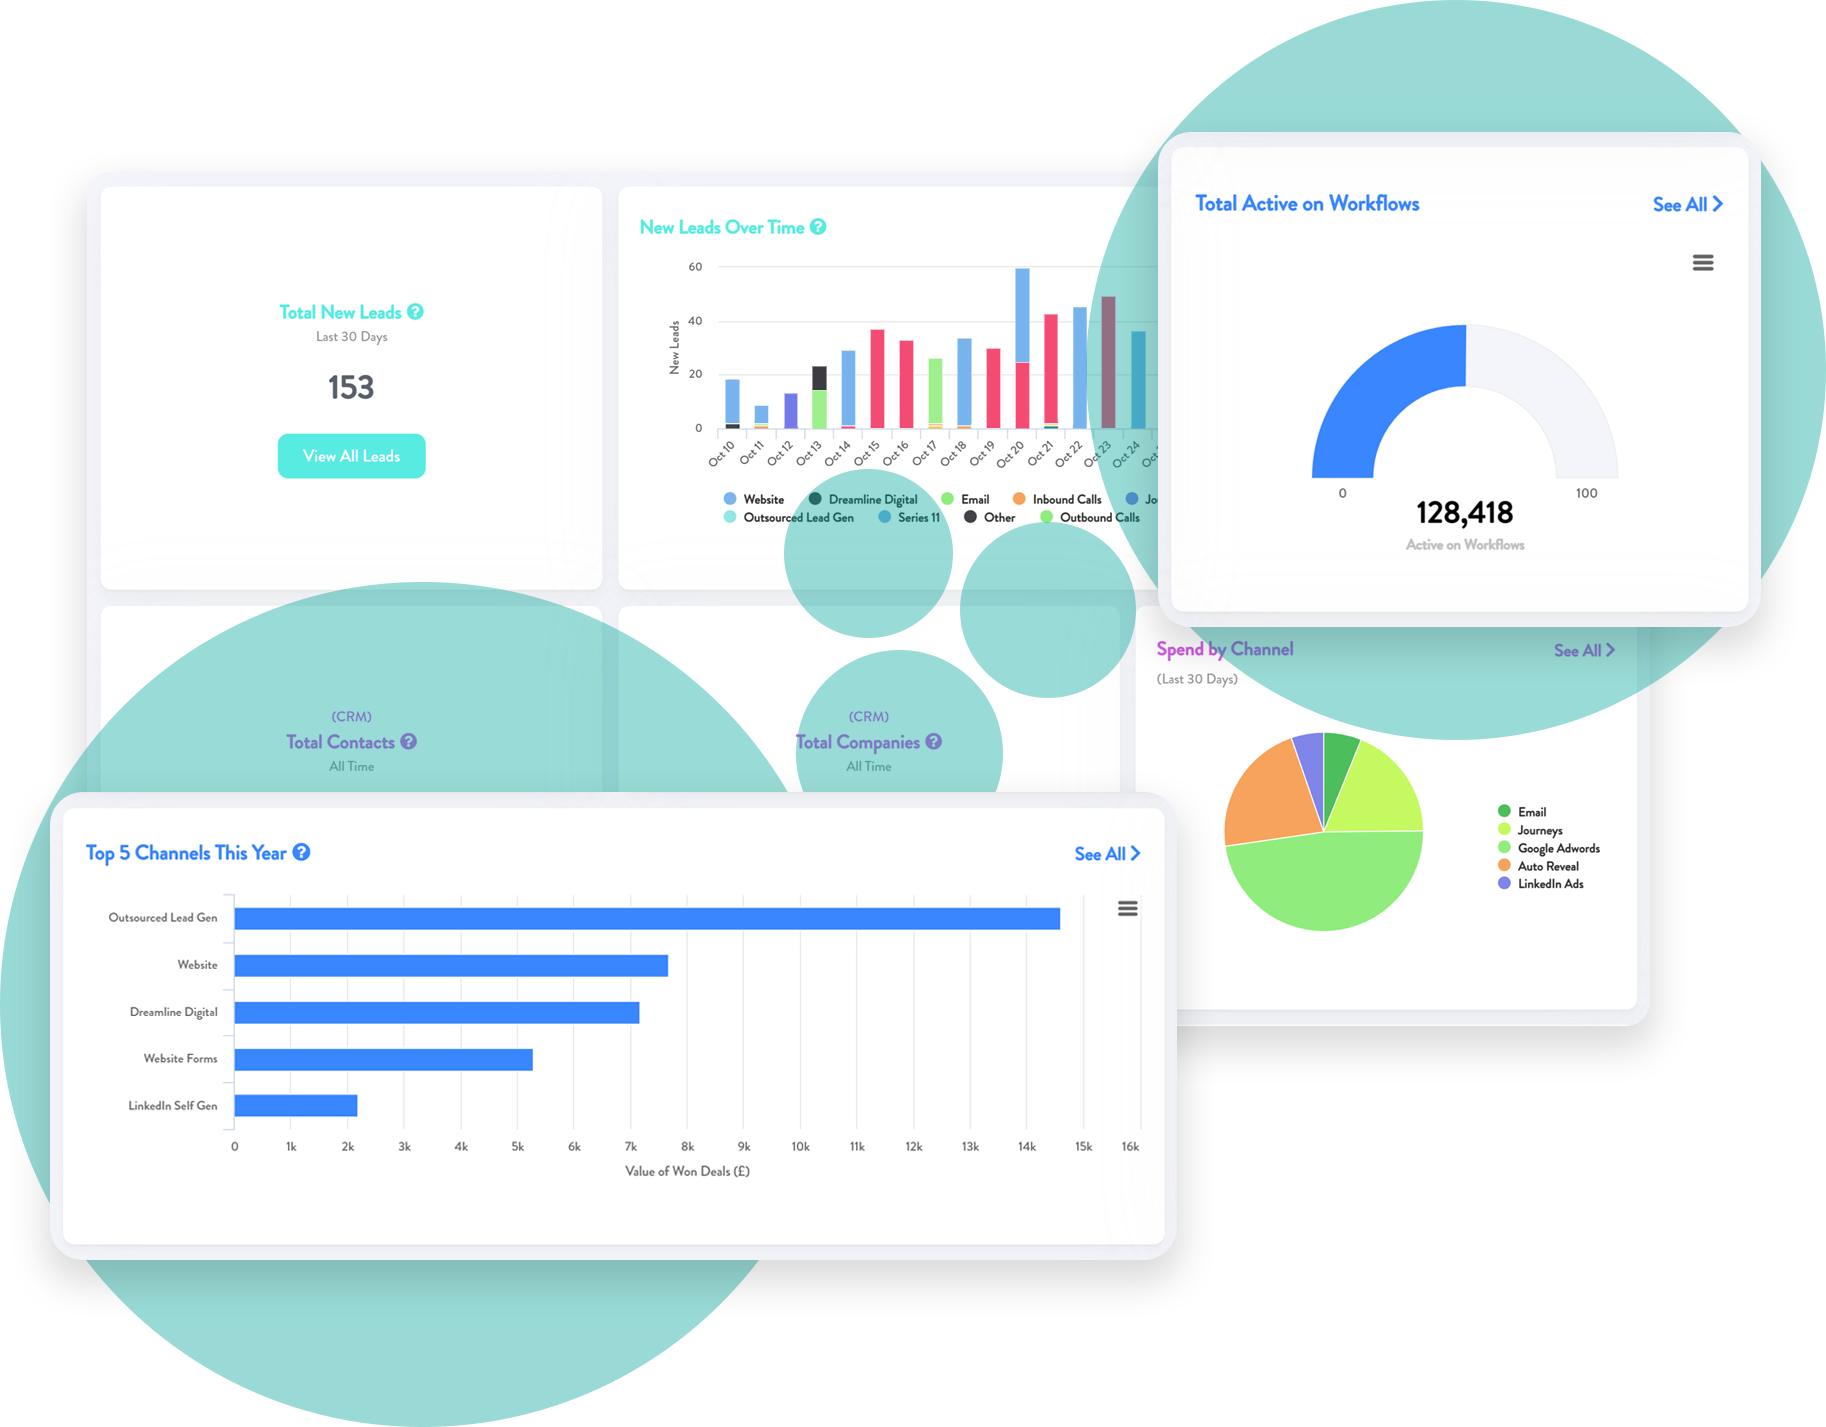
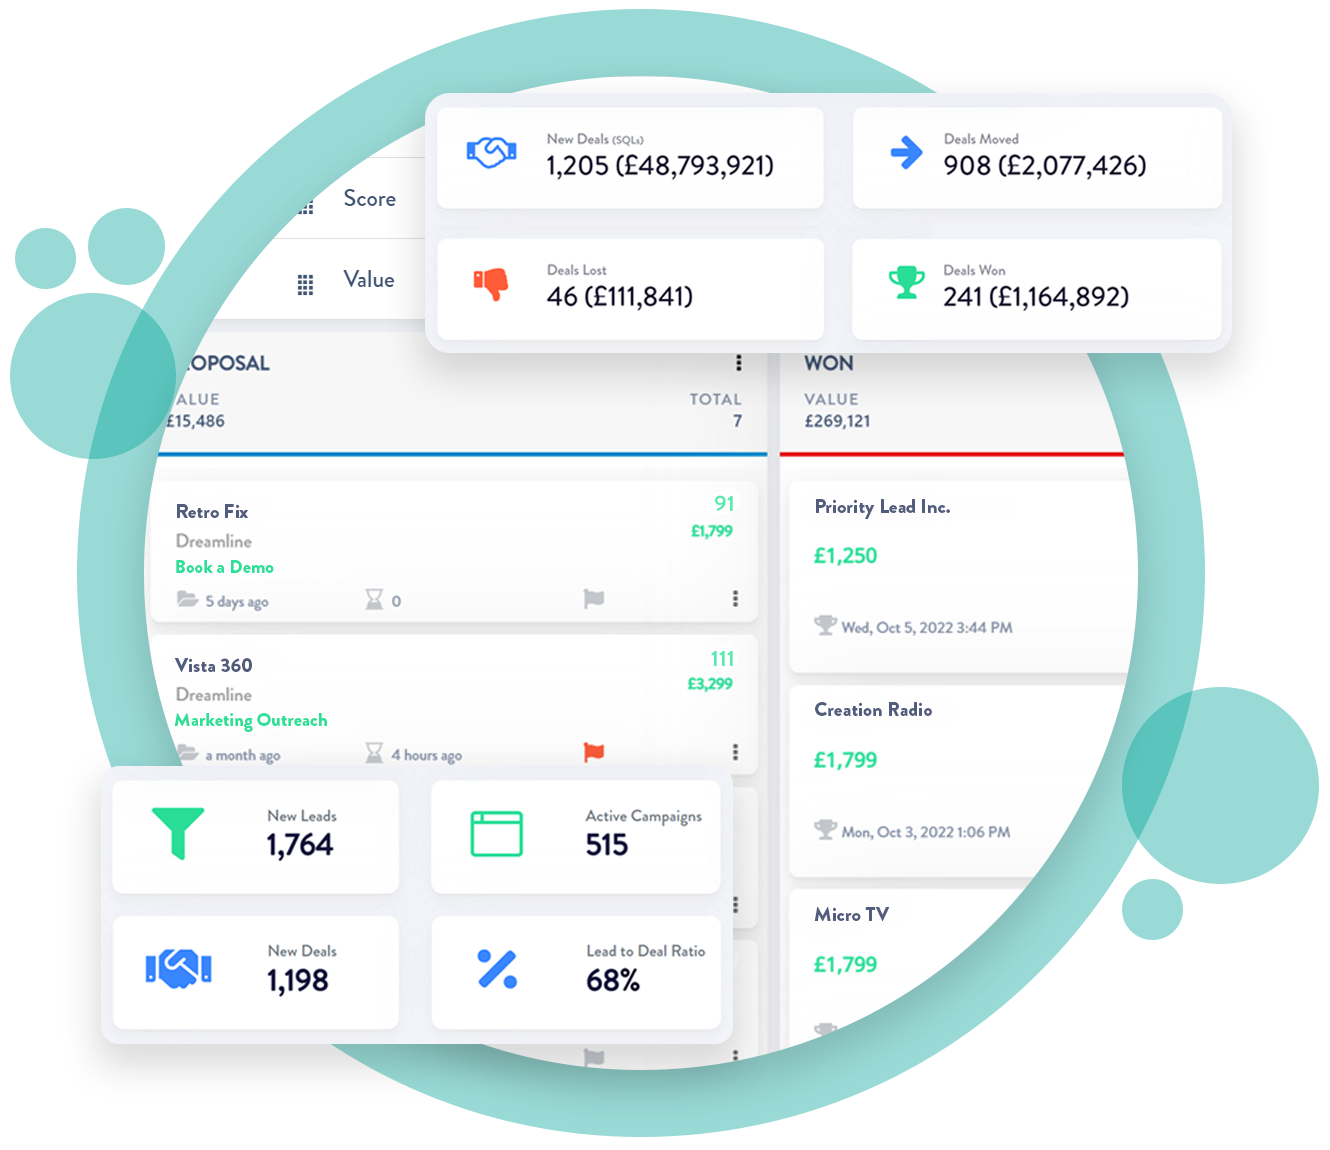
Conversion Rates: Revenue operations teams track users throughout their entire lifespan with your company — covering their customer journey from anonymous website visitor > lead > paying customer. All of which means they’re uniquely placed to develop strategies that help:
- Your marketing team to engage existing customers based on behavioural data.
- Your customer support team to target opportunities for upsells and cross-sells based on a customer’s pain points and business goals and identify customers at risk of churning.
The more conversions, renewals, upgrades, and cross-sells you secure, the higher your customer lifetime value will be.
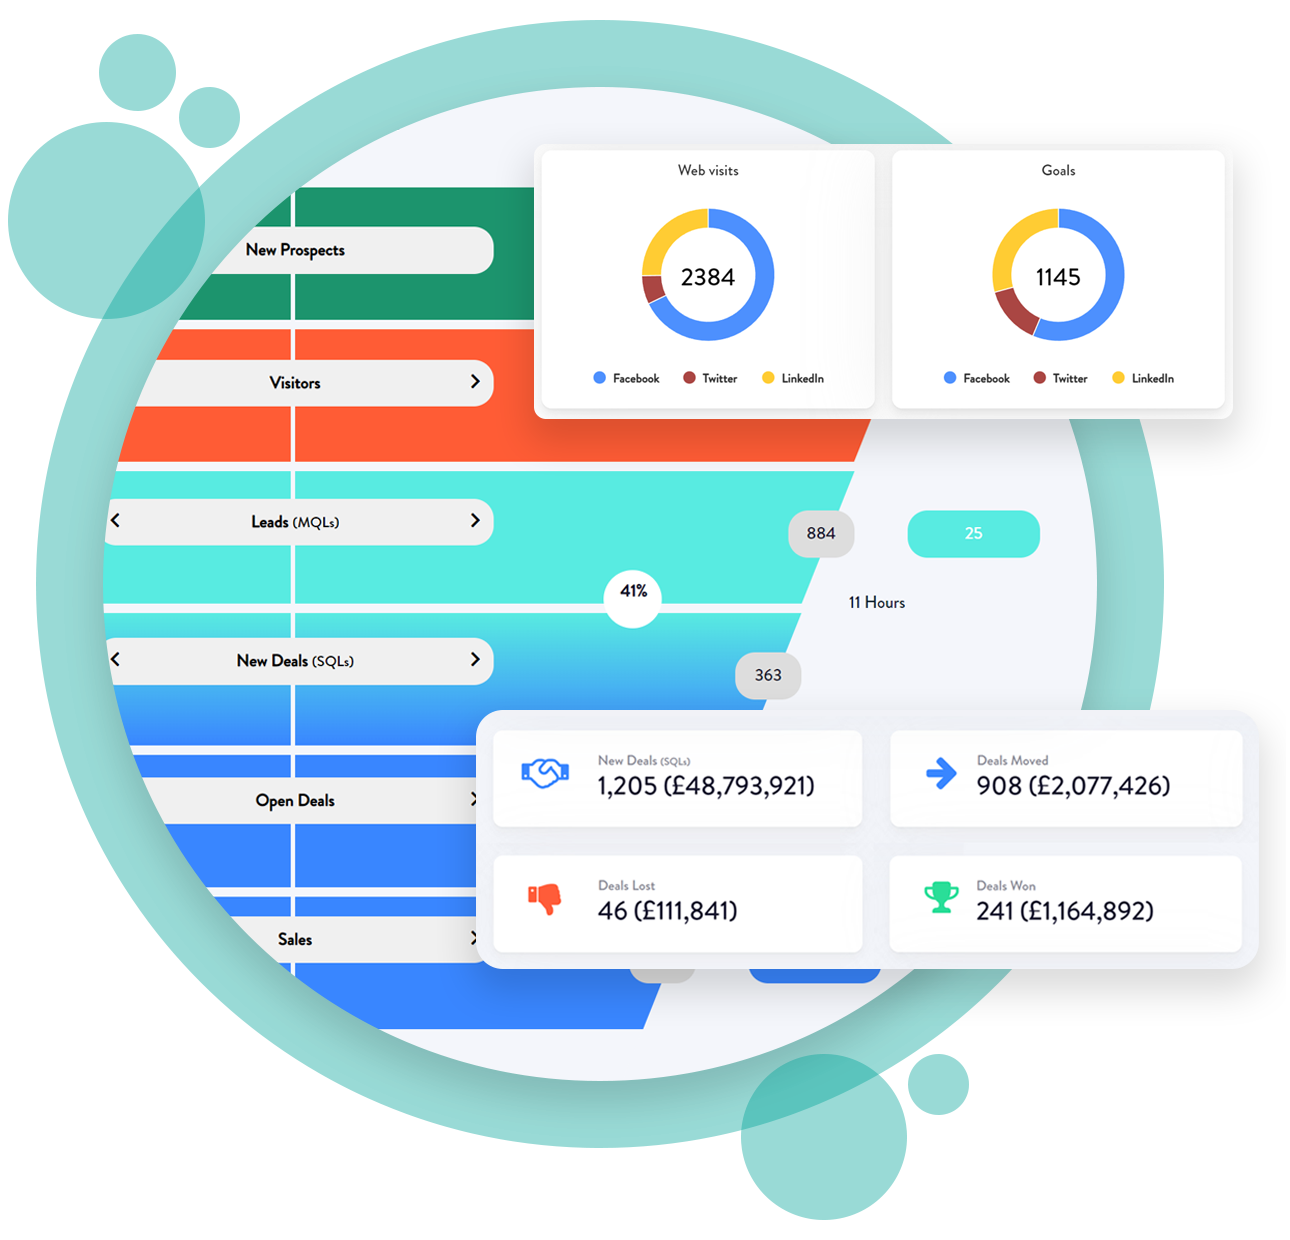
Pipeline Velocity: 50% of high-performing sales organisations have a structured sales process in place. A structured sales process supported by the right sales tech stack speeds up the deals moving through the pipeline and increases the number of quality leads.
The rate at which an organisation can move leads through the pipeline to the closing stage is known as pipeline velocity. Because pipeline velocity is a crucial metric responsible for driving revenue, Revenue Operations supports sales, marketing, and customer success departments with sales enablement practices that affect your business as a whole. By tracking pipeline velocity, you can easily identify bottlenecks and inefficiencies in their sales processes and optimise their sales strategies accordingly.
Conclusion: At the end of the day, tracking the correct KPIs is essential for assessing the success and growth of your organisation. Measuring metrics like Revenue Growth, Customer Acquisition Cost, Customer Churn Rate, Conversion Rates and Pipeline Velocity helps to identify weaknesses and develop strategies for improvement. Taking a prudent approach to maximising your RevOps metrics allows your team to generate long-term success and increase your overall profitability.
Want to talk to a Zymplify expert on how revenue platform could work for your business personally? Then sign up for a free personalised demo here.